Introduction
The physical climate risks are no longer an abstract environmental topic. They directly affect business performance: business interruptions, rising insurance costs, supply chain tensions, deterioration of working conditions, loss of asset value, increased cost of financing.
Annual economic losses for European businesses linked to these risks have multiplied fivefold since the 1980s, while a growing share of these losses is not compensated by insurers. In this context, adaptation becomes a key lever for resilience and value creation.
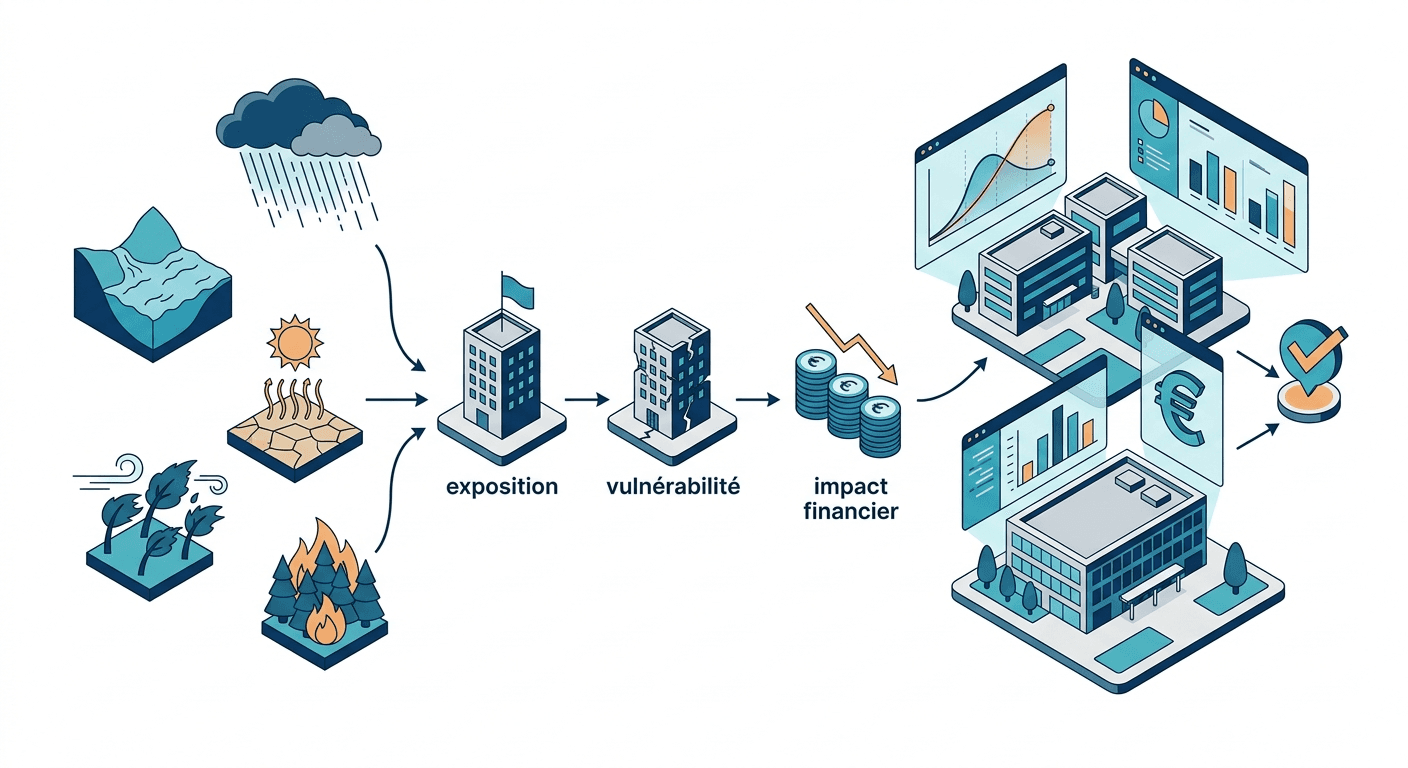
However, to take action, one still needs a few keys to interpretation. Managing physical climate risks is still a recent field for companies, compared to foreign exchange, interest rate, or commodity risks. It relies on specific concepts and metrics that are essential to master in order to inform decisions. Understanding how a climate hazard turns into a financial impact requires returning to a few simple concepts: hazard, exposure, vulnerability, financial impact.
Hazard encompasses a wide variety of phenomena (heat, drought, floods, wind, wildfires, etc.). Exposure depends on the location of the site. Vulnerability reflects the sensitivity of the site—buildings, equipment, organization—to these hazards. Finally, the financial impact results from the way the intensity of a hazard, combined with the level of vulnerability, translates into economic losses. While each hazard is measured by distinct climate indicators, they all have one thing in common as soon as they affect business operations: they are measured in euros.
From Climate to Finance: A Transformation Chain
Moving from a climate indicator to a financial impact therefore requires a precise transformation chain and a sufficiently granular level of information. Take the example of a flood. The starting point is a hazard: precipitation, whether cumulative or sudden, which results locally in a water depth, associated with a probability of occurrence.
The same water depth does not have the same consequences depending on whether sensitive equipment is in the basement or on an upper floor, whether protections exist or not, or whether business activity can be easily restarted. This is where vulnerability comes in. To translate this situation into losses, damage functions are used, linking the intensity of the hazard (for example, a water depth) to the level of destruction of assets: building, equipment, inventory. In addition to these direct damages, there are business interruption functions, which make it possible to estimate the duration and cost of business downtime, often exceeding the property damage alone.
These elements must be combined with site-specific financial data: asset value, production level, margins, operating costs. It is this combination that makes it possible to estimate a financial loss and its evolution over time if nothing is done to reduce vulnerability, in other words, to adapt the site.
In summary, moving from climate to finance consists of linking a physical intensity, a probability, a specific vulnerability, and real economic data.
Financial Risks Like Any Other
The management of physical climate risks shares a fundamental commonality with other financial risks: it is not static and requires regular updating. The climate is evolving, the environment around sites is changing, and the company's activities are shifting. As with currency or interest rate risks, the company's financial exposure must be reassessed regularly, at least annually.
Such an approach necessarily relies on a granular analysis, site by site, hazard by hazard. By design, it is hardly compatible with synthetic indicators meant to summarize climate risk into a single value—low, moderate, or high—as many providers offer today.
The Structural Limitation of Exposure or Risk Scores
These scores were not designed to manage risk at the corporate scale. They primarily meet the needs of asset or portfolio managers seeking to qualify the average exposure of a set of assets, compare sectors, or rank companies. In this framework, the use of sector averages may be justified.
However, at the level of an individual company, these approaches quickly become ineffective.
Indeed, these scores rely on standardized assumptions: average asset values, activity levels, generic site characteristics. The actual vulnerability of each site is rarely known and often approximated. The result is high variability: for the same sector or company, scores can diverge significantly from one provider to another. Some managers bypass the problem by using averages and standard deviations, for lack of a better alternative.
Above all, a score does not answer the essential questions of a business leader:
· Which hazards will impact my business?
· What will be the cost, today and tomorrow?
· Which critical sites or suppliers are most at risk?
· And most importantly: how can it be reduced?
By construction, an exposure score based on averages allows for ranking, but it does not explain and does not allow for management.
And for these legacy providers, moving from a score intended for portfolio managers to a granular modeling of company-specific financial impacts requires rethinking everything. Very few players have, from the outset, developed an approach to manage risks at the site or corporate scale and translate them into actionable financial impacts. This is the case with Tardigrade AI.
Financial Metrics: Making Risk Actionable
It is precisely to answer these questions that financial metrics for climate risk were developed. They are based on a simple principle: translating a physical reality into an economic impact using a robust causal chain (hazard, exposure, vulnerability, impact), used for decades in natural catastrophe models. The intensity of the hazard causes damage, this damage leads to business interruptions, and the whole translates into economic losses. It is this chain that allows moving from climate to finance.
The first metric is the Expected Annual Loss (EAL). It corresponds to the average loss that a site or company can anticipate each year, taking into account the probability of events and their consequences.
Unlike an insurance premium, it reflects neither commercial margins, regulatory constraints, nor pooling mechanisms. It solely measures the expected economic loss, given the actual vulnerability of the site. As such, it constitutes a particularly useful metric for comparing assets, prioritizing adaptation investments, or integrating risk into financial models. Two sites can exhibit an identical EAL while being exposed to radically different risk profiles, hence the importance of having EAL values associated with each critical hazard (flooding, severe winds, wildfire ignition, etc.).
EAL is supplemented by extreme or maximum loss metrics, generically known as Probable Maximum Loss (PML) or more generally Climate Value at Risk (VaR). Where EAL answers the question "how much is the company exposed to on average each year", these indicators seek to estimate what the damage would be in the event of a disaster. The potential maximum loss is an essential metric for assessing the company's financial resilience, sizing insurance coverage, or anticipating liquidity needs.
These two indicators are complemented by a forward-looking metric essential for decision-making: the cost of inaction. It corresponds to the cumulative future annual losses, discounted at the cost of capital, if no adaptation measures are implemented. This approach incorporates not only the recurrence of events and their intensification due to climate change, but also often decisive indirect effects: changes in replacement costs, inflation, and the company's cost of capital. The cost of inaction makes it possible to anticipate potential increases in insurance premiums or even loss of insurability, deterioration in financing costs, or asset write-downs. This is generally where the reasoning shifts: comparing the cost of adaptation today to the cost of inaction tomorrow turns a constraint into an investment decision.
Are the Numbers Accurate?
A question often arises: how can we be sure that the estimated damages are "accurate"?
The answer is less intuitive than it seems. First, do we ask the same question to an insurer when they provide an insurance premium? Yet, from one insurer to another, the premium varies, because each insurer's reading of the risk, the existing type and level of exposure, and the client topology vary. For conventional personal insurance, studies show the premium varies between 10% and 30% from one insurer to another. In the case of climate insurance, the premium can vary by a factor of two. This is precisely why brokers exist: to identify among insurers the one capable of best addressing the risk incurred by the company, taking into account its own constraints.
Therefore, there is not, and never will be, a single universal value for damage from a given hazard. But what can be assessed, on the other hand, is the robustness of the way these ratios are estimated.
Damage functions that link the intensity of a hazard to a level of loss are not arbitrary inventions. They are based on several decades of work in hydrology, catastrophe economics, structural engineering, and insurance modeling. In the case of floods, for example, the relationship between water depth and damage level is extensively documented. Water depth is the main explanatory factor for property losses. This relationship is non-linear: damage remains low at low intensity, then increases rapidly once certain critical thresholds are reached. These functions are calibrated using international institutional references, such as models developed by FEMA (HAZUS) in the United States or the European Commission's Joint Research Centre, as well as insurance databases and lessons learned from real-world events.
In other words, their credibility rests on three pillars: scientific foundations, empirical calibrations, and physical coherence of damage mechanisms.
Within a clear and transparent methodological framework, the goal is not to eliminate uncertainty around an estimate, but to know that it exists, and that it does not impair decision-making capability.
How to Use Climate Risk Financial Metrics for Decision-Making?
The primary use is prioritization. Not all exposures are comparable because not all vulnerabilities are the same. On the other hand, financial metrics consistently make it possible to identify sites, assets, or links in the value chain that concentrate risk, and thus prioritize actions.
They then help inform investment decisions, particularly adaptation CAPEX. By comparing the cost of measures (protection, relocation, redundancy, organization) to the cost of inaction, the company can make rational trade-offs and deduce the return on investment (ROI).
These metrics also play a key role in insurance management. They allow for a better understanding of one's risk profile, negotiating appropriate coverage, or even arbitrating between self-insurance and risk transfer. They also directly influence financing. Financial institutions are increasingly integrating physical climate risks into their analyses. A company capable of quantifying and reducing its exposure improves its risk profile and, ultimately, its financing conditions.
Finally, they make it possible to broaden the analysis to the supply chain. Disruptions do not only originate from owned sites, but also from critical suppliers. Factoring in these dependencies helps anticipate risks that are often invisible.
Adapting Means Creating Value
Long perceived as a cost, adaptation increasingly appears as a driver of value creation. Reducing damage, limiting downtime, improving business continuity, securing working conditions: all of these elements translate directly into economic performance.
The effects go beyond operations. Better risk management improves insurability, contains premium costs, secures access to financing, and preserves asset value. Conversely, inaction exposes companies to accumulating losses, gradual deterioration of insurance and financing terms, and an increasing risk of asset write-downs.
In this context, adaptation is no longer an environmental constraint.
It becomes a strategic investment, at the heart of corporate competitiveness and resilience.
About Tardigrade AI
Anticipate, measure, decide
Tardigrade AI helps businesses move from climate risk to decision-making: forecasting events that threaten their operations, quantifying their cost, and choosing the most cost-effective adaptation measures.
Protect
5-day operational alerts
Anticipate heat, cold, wind, rain, hail, or snow up to 5 days in advance. An alert is only sent if a critical threshold for your business, your sites, or your teams is about to be exceeded.
Short term
Horizon
Cost of inaction and adaptation plan
Quantify in euros the climate impact on each of your sites or across your portfolio, then identify the most cost-effective adaptation measures from a catalog of 62 quantified solutions.
Long term